S&P 500 predictions in R
Linear regresstion for stock index returns from 1990-2010 using R
S&P 500 stock index from 1990 – 2010
My project is using R to analyze Weekly data frame in ISLR package. This data frame contains 9 features for 1089 weeks of stock index returns from 1990 to 2010. Analysis was performed using tidyverse and glmnet packages.
First, I fit a ridge-penalized linear regression model and a lasso-penalized linear regression model to predict the percentage return today from the percentage return for the five previous weeks.
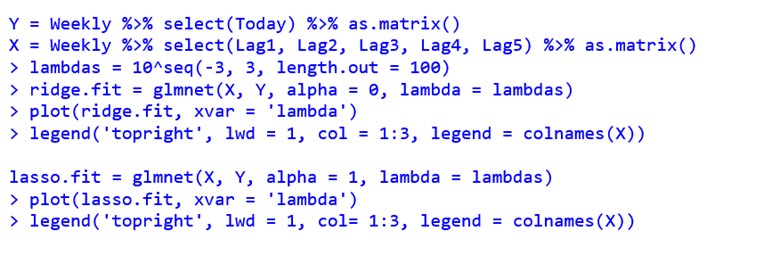
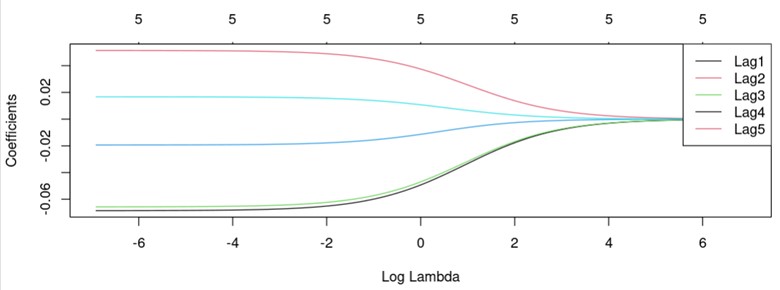
I considered 100 tuning parameter (λ) values evenly spaced between 0.001 and 1000 on a base-10 logarithmic scale and plotted the coefficients as a function of log(λ)
Code below:

Plots
Ridge-penalized model

Lasso-penalized model

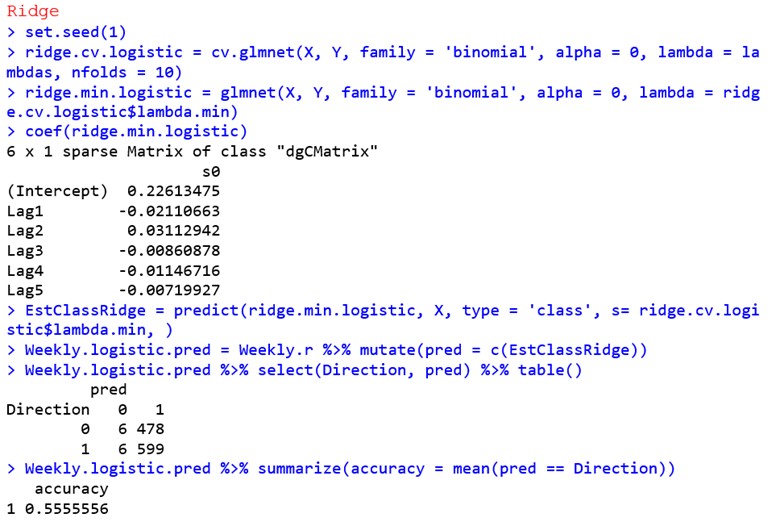
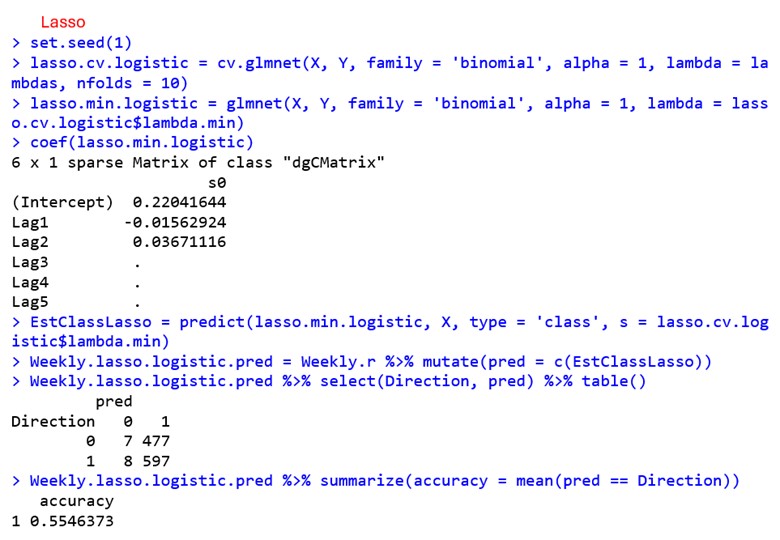
Next I performed 10-fold cross-validation for a ridge-penalized and for a lasso-penalized linear regression model to predict the percentage return today from the percentage return for the five previous weeks. For each model, I use the fit with the λ value that has the smallest cross-validation error rate in order to predict classes for the training data, then printed a confusion matrix and an estimate of classification training accuracy to the console.
Code/Results


Explanation
In this project, I utilized ridge and lasso-penalized linear regression models to analyze weekly data of the S&P 500 stock index returns from 1990 to 2010. The goal was to predict the percentage return today based on the percentage returns for the five previous weeks.
Model Training and Evaluation
I began by fitting ridge and lasso-penalized linear regression models to the data. To determine the optimal regularization parameter (λ), I considered a range of 100 tuning parameter values evenly spaced between 0.001 and 1000 on a base-10 logarithmic scale. The coefficients were plotted as a function of log(λ) to understand the effect of regularization on feature selection.
The ridge-penalized model revealed the following coefficients for the features:
- Intercept: 0.22613475
- Lag1: -0.02110663
- Lag2: 0.03112942
- Lag3: -0.00860878
- Lag4: -0.01146716
- Lag5: -0.00719927
The model achieved an accuracy of approximately 55.56% on the training data. True “Up” predictions accounted for 99% of the actual “Up” movements, while true “Down” predictions accounted for 1.2% of the actual “Down” movements.
The lasso-penalized model resulted in the following coefficients for the features:
- Intercept: 0.22041644
- Lag1: -0.01562924
- Lag2: 0.03671116
- Lag3: Not significant
- Lag4: Not significant
- Lag5: Not significant
Despite some coefficients being set to zero, the model achieved a similar accuracy of approximately 55.46% on the training data. True “Up” predictions represented 98.6% of the actual “Up” movements, while true “Down” predictions represented 1.4% of the actual “Down” movements.
Both ridge and lasso-penalized linear regression models demonstrated comparable performance in predicting S&P 500 stock index returns based on past data. While the lasso model provided a more parsimonious solution by setting some coefficients to zero, both models achieved similar accuracy rates. These findings suggest that either model could be used effectively for predicting stock market movements based on historical data within the given timeframe.
The analysis provides valuable insights into the application of penalized regression techniques in financial forecasting, offering a robust framework for future research and decision-making in investment strategies. Further exploration could involve refining the model parameters, incorporating additional features, or extending the analysis to different time periods or financial markets.